Exercise #3: Eₘ Calculation
In this exercise, we will perform a Eₘ calculation (redox titration over a defined Eₕ range) using a protein file using MCCE4 .
Background
Cytochrome c is a small mitochondrial protein that functions as an electron carrier in the respiratory chain, enabling ATP synthesis. Its redox potential is a critical determinant of this function and is regulated by the protein’s electrostatic environment, which can be analyzed using continuum electrostatics methods. In this example tutorial we will use the cytochrom c stucture from PDB ID: 1AKK.
The experimental Eₘ of Cytochrome c is typically around 260 mV at pH 7.0.
0. Pre-requisite:
Ensure you have the conda enviorment for mc4 activated.
conda activate mc4
1. Prepare the Calculation
Enter the working directory for this exercise:
cd mcce_workflows
mkdir ex3; cd ex3
Download the PDB file for 1AKK:
getpdb 1akk
A successful download should display the following message:
[ INFO ] Download completed: 1akk.pdb
We strongly recommend to run
p_infoto inspect an unfamiliar PDB file and verify if it is compatiblity with MCCE4 prior to performing a simulation.p_info 1akk.pdb
2. Perform Eₘ using run_mcce4
The easiest way to run a MCCE4 simulation is with run_mcce4. It is preset to run a full simulation (ending with a titration) and return the Eₘ of titratable residues into one of its output files called pK.out upon successful completion.
run_mcce4 1akk.pdb -type eh -initial 0 -interval 60 -n 15
- The conformer occupancies are in file
fort.38. - The net charge is in file
sum_crg.out. - The calculated Eₘs are in file
pK.out
See here for more details on what’s exactly happening when running this run_mcce4 or customizing runs!
3. Interpret Eₘ results
A trimmed version of the pKₐ/Eₘ report is in file pK.out, which contains the calculated pKₐ/Eₘ values for titratable side chains. You can see the full report in pK_extended.out.
- pKa/Em : Calculated MCCE4 pKₐ/Eₘ values
- n (slope) : Slope of titration curve (extrapolated from
fort.38) and the Henderson-Hasselbalch equation. - 1000×chi2 : 1000 times the chi-squared value. Higher the number, the less accurate the result.
cat pK.out
Eh              pKa/Em    n(slope) 1000*chi2
NTG+A0001_       >840.0
ASP-A0002_        <0.0
GLU-A0004_        <0.0
LYS+A0005_       >840.0
LYS+A0007_       >840.0
LYS+A0008_       >840.0
LYS+A0013_       >840.0
GLU-A0021_        <0.0
LYS+A0022_       >840.0
LYS+A0025_       >840.0
HIS+A0026_        <0.0
LYS+A0027_       >840.0
HIS+A0033_       >840.0
ARG+A0038_       >840.0
LYS+A0039_       >840.0
TYR-A0048_       >840.0
ASP-A0050_        <0.0
LYS+A0053_       >840.0
LYS+A0055_       >840.0
LYS+A0060_       >840.0
GLU-A0061_        <0.0
GLU-A0062_        <0.0
GLU-A0066_        <0.0
TYR-A0067_       >840.0
GLU-A0069_        <0.0
LYS+A0072_       >840.0
LYS+A0073_       >840.0
TYR-A0074_       >840.0
LYS+A0079_       >840.0
LYS+A0086_       >840.0
LYS+A0087_       >840.0
LYS+A0088_       >840.0
GLU-A0090_        <0.0
ARG+A0091_       >840.0
GLU-A0092_        <0.0
ASP-A0093_        <0.0
TYR-A0097_       >840.0
LYS+A0099_       >840.0
LYS+A0100_       >840.0
GLU-A0104_        <0.0
CTR-A0104_        <0.0
HEM+A0105_      221.558    1.005     0.008
PAA-A0105_      735_
Understanding Redox Titration Curves and Output Files
sum_crg.out
- The
sum_crg.outfile is used to generate redox titration curves (occupancy vs Eh). Only residues whose charge changes with Eh produce meaningful curves. In this system, the heme group (HEM+A0105_) shows a clear sigmoidal transition, allowing determination of Em, while all other residues remain flat and therefore do not have a defined redox midpoint.
Redox-active center (HEME)
The heme group is the primary redox-active site and shows a clear sigmoidal titration curve. Its electron occupancy transitions from 0 to 1 as Eₕ increases, allowing MCCE to determine a well-defined midpoint potential (Eₘ). This behavior is reflected in:
- A finite Eₘ value in
pK.out - A smooth transition in electron occupancy in
sum_crg.out.
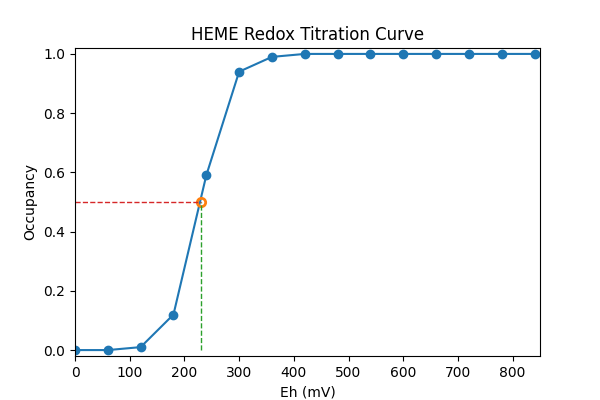
- The graph shows the electron occupancy of HEM as a function of redox potential (Eₕ). The HEM group is mostly unoccupied at low potentials, becomes partially reduced around 180–360 mV, and fully reduced at high potentials. The sigmoidal curve indicates the midpoint potential (Eₘ) where HEM is 50% occupied.
- The redox titration curve of the heme group showing the midpoint potential (Em ≈ 221.5 mV). The red marker indicates 50% occupancy, with dashed guide lines projected to the Eh and occupancy axes.
Acidic residue (Asp or Glu)
Some acidic residues appear in pK.out with values such as:
Em > 840
- This indicates that the residue does not undergo a redox-linked transition within the sampled Eₕ range. Its protonation state remains effectively constant, so a meaningful midpoint potential cannot be determined.
Basic residue (Lys or Arg)
Similarly, basic residues may appear as:
Em < 0
- This indicates that the basic residue remains fully protonated over the entire Eₕ range sampled. Because it does not undergo a redox transition within this range, its protonation state is insensitive to changes in Eₕ and is not directly redox-active.
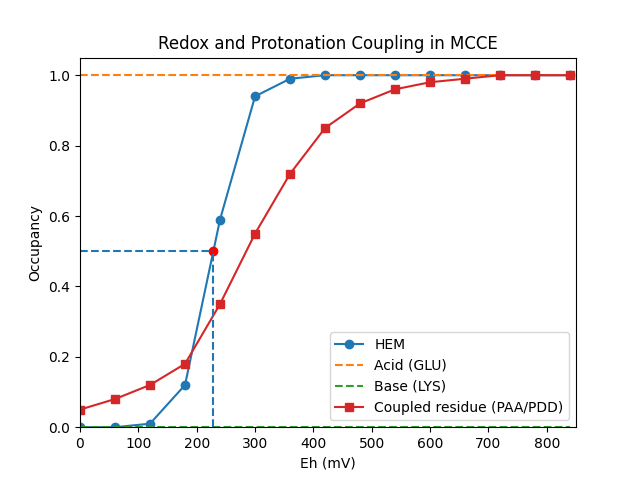
- Only the heme shows a true midpoint potential, while most amino acids either remain fully protonated/deprotonated or respond indirectly through redox-coupled protonation.
Redox–proton coupled residue
Some residues do not have a defined Eₘ in pK.out, yet their protonation state changes as the heme is oxidized or reduced. This behavior can be observed in sum_crg.out.
- Such residues are redox–proton coupled: they do not undergo electron transfer themselves, but their protonation is energetically linked to the redox state of the heme.
Optional Step: To analyze the ionization energy of heme at the midpoint:
mfe.py HEM+A0105_A more detailed explanation of mfe.py program can be found here MFE Tutorial
Benchmark Eₘ (Heme electrochemistry)
For your information
Heme acids: in cytochrome C is coordinated by two ligands, HIS18 and MET80. Since they behave differently from standard HIS and MET residues, they must be renamed. step1.py can process HIS, MET, and CYS residues when they act as ligands to heme.
HEM and HIS are treated differently in cytochrome c. One axial ligand is histidine (His18) and the other is methionine (Met80). Histidine coordinates the iron through its imidazole nitrogen, which does not change oxidation state and does not directly donate or accept electrons. However, it affects the redox potential (Eₘ) indirectly by altering the ligand field, influencing the electrostatic stabilization of Fe³⁺ versus Fe²⁺, and may undergo protonation or deprotonation coupled to redox changes. Therefore, His is considered primarily for its electrostatic contribution rather than electronic effects.
Check out in customizing MCCE4 simulations here! Customizing Runs!